2. Managing the System
7 minute read
In this chapter, you will learn how to monitor, manage and configure your UMH instance with the Management Console.
At this stage, you should have already installed the UMH on your device. If you have not done so, please follow the steps in the Installation chapter first.
A Few Words About the Communication
Now that you have connected a UMH instance to the Management Console, you might be curious about how the Management Console communicates with the instance.
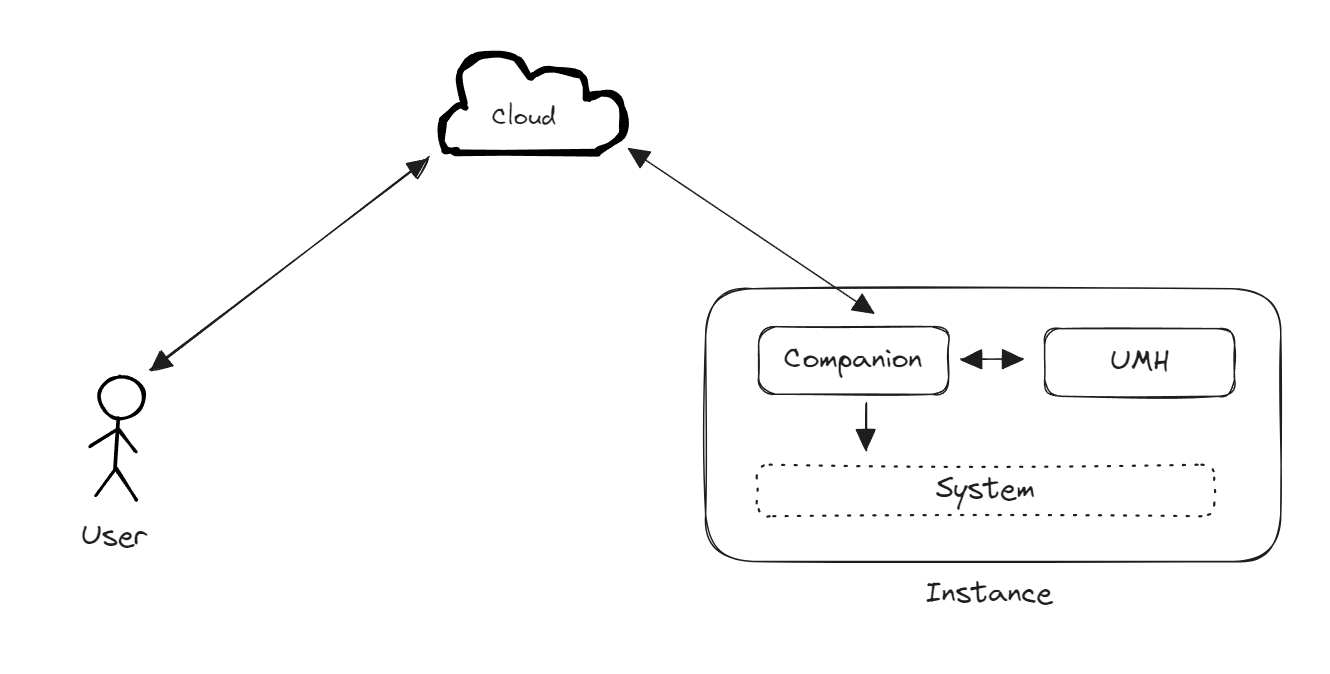
The Management Companion, serving as an agent within each UMH instance, provides a secure link to the Management Console. It enables comprehensive and secure monitoring and management of the UMH, ensuring system health and streamlined configuration, all while acting as a vigilant watchdog over system components and connected devices.
The diagram below illustrates the communication flow between the Management Console and the instance:
For more information, visit the architecture
Overview of Your Instances
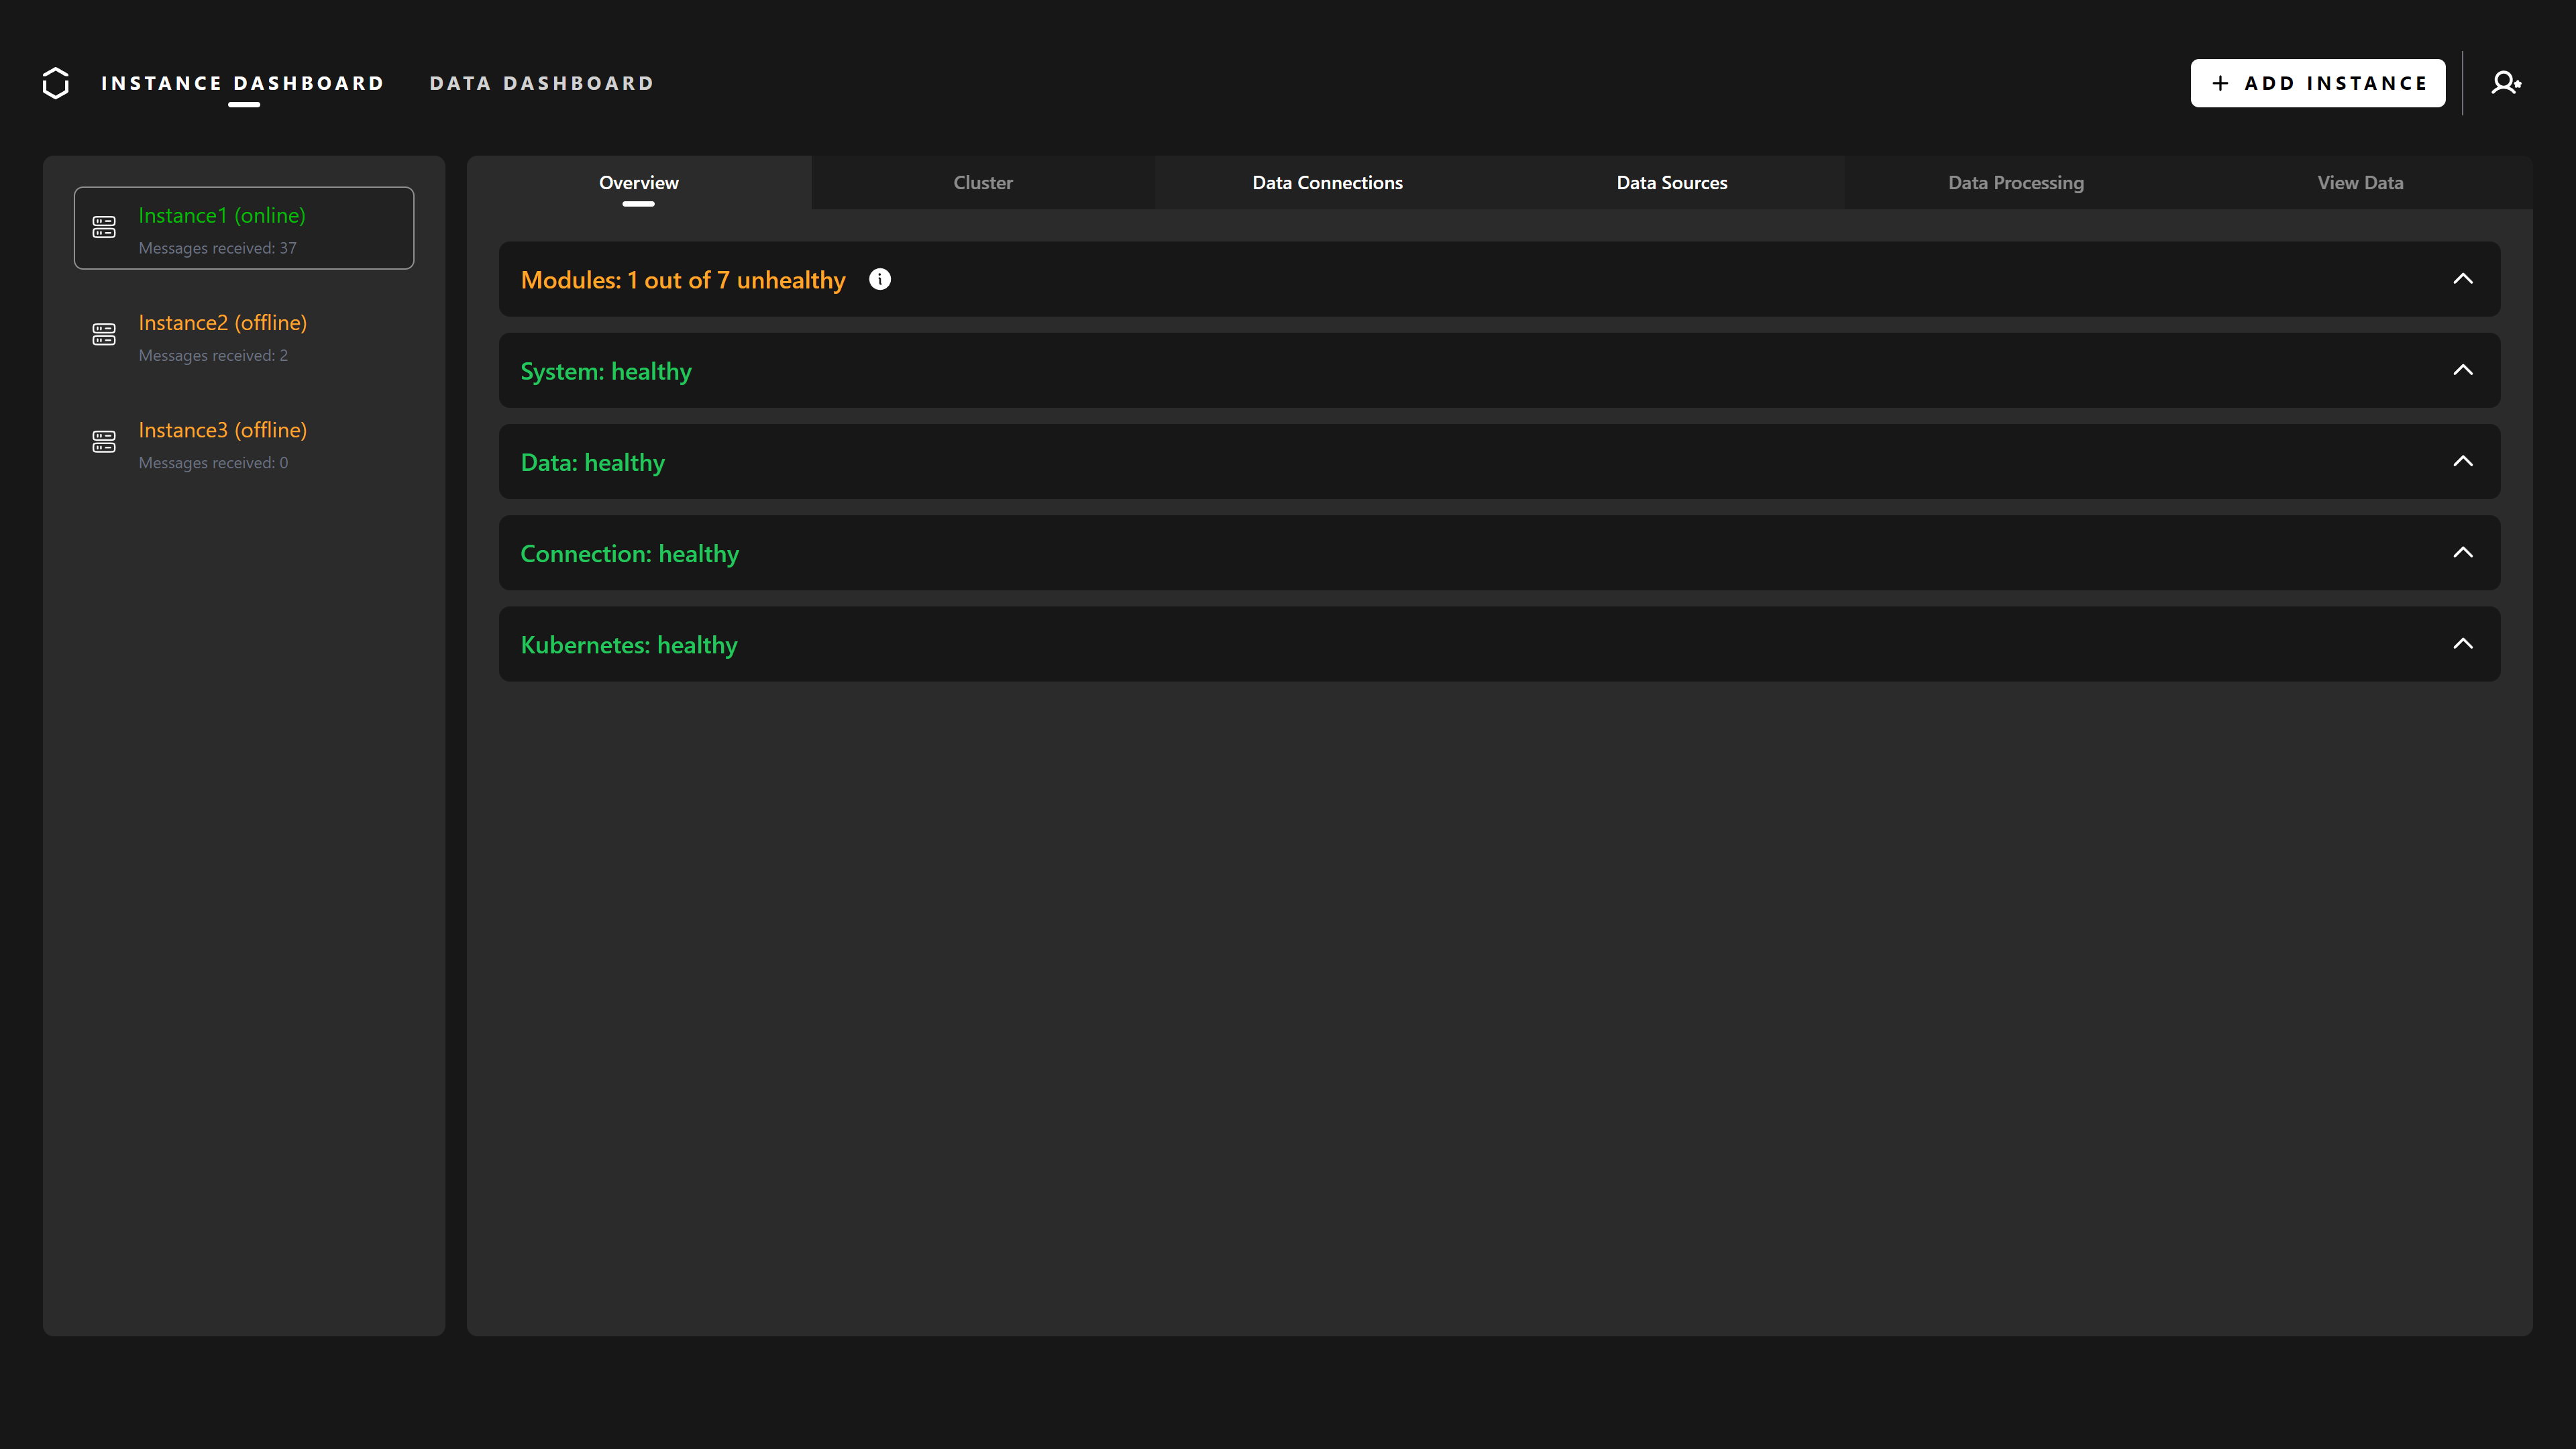
On the left side of the Management Console, you can view the list of your instances. If you have just installed the UMH, you should see only one instance in the list.
The status of your instance is indicated by color: green means everything is working properly, while yellow indicates that there may be a connection issue.
The Messages Received statistic shows the number of messages received by you from the instance since you opened the Management Console. It is usually a good indicator of the health of the connection to the Companion. If the number is not increasing for 10 seconds, the instance is considered disconnected.
Monitoring the Instance’s Status
From the instance dashboard, in the overview tab, you can view the status of your instance. There are multiple interfaces that display the status of each component of the system.
Modules
A Module refers to a group of workloads in the United Manufacturing Hub responsible for specific tasks. For example, the Historian & Analytics module represents the microservices, storage, and connections that are responsible for storing and analyzing data.
In the Modules tab, you can view the status of each module. If a module is not healthy, it means that one or more of its components are not functioning properly.
System
In the System tab, you can view the resource usage of your device, as well as some system’s information.
If there is an overload on the device, you can view it here. An overloaded device is unable to handle the workload, and you should consider upgrading the device.
Data
In the Data tab, you can see an overview of the data infrastructure, including the number of messages going through the message broker, those stored in the database, and messages received by each data source.
Connection
In the Connection tab, you can view the status of all the data source connections configured in the system. A non-healthy connection indicates that the device and the data source are unable to communicate.
Kubernetes
In the Kubernetes tab, you can check for any error events in the Kubernetes cluster. Any errors suggest that the cluster is not operating correctly.
Additionally, this tab displays the version of the United Manufacturing Hub and the Management Companion currently installed on your device.
Manage the Instance
Before you begin, ensure that you are connected to the same network as the instance for accessing the various services and features discussed below.
While a graphical user interface for managing the instance is not yet available, you can still manage it via the command line.
Access the Command Line
Access your device’s shell either directly or via SSH. Note: Root user access is required for the following commands.
In UMH’s current version, add --kubeconfig /etc/rancher/k3s/k3s.yaml to each kubectl command. Root privileges are needed to access it. The installation path of kubectl might vary (e.g., /usr/local/bin/kubectl on RHEL/Linux, /opt/bin/kubectl on flatcar). These paths may not be in the root user’s PATH, so the commands below might appear complex.
Interact with the Instance
First, set this environment variable:
export KUBECONFIG=/etc/rancher/k3s/k3s.yaml
You can bypass this by adding –kubeconfig /etc/rancher/k3s/k3s.yaml to your commands. All instructions in this chapter will include this flag.
Then, to get a list of pods, run:
sudo $(which kubectl) get pods -n united-manufacturing-hub --kubeconfig /etc/rancher/k3s/k3s.yaml
For a comprehensive list of commands, refer to the Kubernetes documentation.
Always specify the namespace when running a command by adding -n united-manufacturing-hub.
Access Node-RED
Node-RED is used in UMH for creating data flows. Access it via:
http://<instance-ip-address>:1880/nodered
Access Grafana
UMH uses Grafana for dashboard displays. Get your credentials:
sudo $(which kubectl) get secret grafana-secret --kubeconfig /etc/rancher/k3s/k3s.yaml -n united-manufacturing-hub -o jsonpath="{.data.adminuser}" | base64 --decode; echo
sudo $(which kubectl) get secret grafana-secret --kubeconfig /etc/rancher/k3s/k3s.yaml -n united-manufacturing-hub -o jsonpath="{.data.adminpassword}" | base64 --decode; echo
Then, access Grafana here:
http://<instance-ip-address>:8080
Use the retrieved credentials to log in.
Access the RedPanda Console
Manage the Kafka broker via the RedPanda Console:
http://<instance-ip-address>:8090
Interact with the Database
UMH uses TimescaleDB. Open a psql session:
sudo $(which kubectl) exec -it $(sudo $(which kubectl) get pods --kubeconfig /etc/rancher/k3s/k3s.yaml -n united-manufacturing-hub -l app.kubernetes.io/component=timescaledb -o jsonpath="{.items[0].metadata.name}") --kubeconfig /etc/rancher/k3s/k3s.yaml -n united-manufacturing-hub -- psql -U postgres
This command will open a psql shell connected to the default postgres database.
Run SQL queries as needed. For an overview of the database schema, refer to the Data Model documentation.
Connect MQTT to MQTT Explorer
Use MQTT Explorer for a structured overview of MQTT topics. Connect using the instance’s IP and port 1883.
Troubleshooting
Error: You must be logged in to the server while using the kubectl Command
If you encounter the error below while using the kubectl command:
E1121 13:05:52.772843  218533 memcache.go:265] couldn't get current server API group list: the server has asked for the client to provide credentials
error: You must be logged in to the server (the server has asked for the client to provide credentials)
This issue can be resolved by setting the KUBECONFIG environment variable. Run
the following command:
export KUBECONFIG=/etc/rancher/k3s/k3s.yaml
Alternatively, use the --kubeconfig flag to specify the configuration file path:
sudo $(which kubectl) --kubeconfig /etc/rancher/k3s/k3s.yaml get pods -n united-manufacturing-hub
“Permission Denied” Error with kubectl Command
Encountering the error below while using the kubectl command:
error: error loading config file "/etc/rancher/k3s/k3s.yaml": open /etc/rancher/k3s/k3s.yaml: permission denied
Indicates the need for root access. Run the command with sudo, or log in as
the root user.
kubectl: command not found error
If you encounter the error below while using the kubectl command:
kubectl: command not found
The solution is to use the full path to the kubectl binary. You can do this by
prefixing the command with /usr/local/bin/ (for RHEL and other Linux systems), or /opt/bin/ (for flatcar) or by adding it to your PATH
environment variable:
/usr/local/bin/kubectl get pods -n united-manufacturing-hub

# or

export PATH=$PATH:/usr/local/bin
Viewing Pod Logs for Troubleshooting
Logs are essential for diagnosing and understanding the behavior of your applications and infrastructure. Here’s how to view logs for key components:
Management Companion Logs: To view the real-time logs of the Management Companion, use the following command. This can be helpful for monitoring the Companion’s activities or troubleshooting issues.
sudo $(which kubectl) logs -f mgmtcompanion-0 -n mgmtcompanion --kubeconfig /etc/rancher/k3s/k3s.yamlTimescaleDB Logs: For real-time logging of the TimescaleDB, execute this command. It’s useful for tracking database operations and identifying potential issues.
sudo $(which kubectl) logs -f united-manufacturing-hub-timescaledb-0 -n united-manufacturing-hub --kubeconfig /etc/rancher/k3s/k3s.yaml
Restarting a Pod for Troubleshooting
Sometimes, the most straightforward troubleshooting method is to restart a problematic pod. Here’s how to restart specific pods:
Restart Management Companion: If you encounter issues with the Management Companion, restart it with this command:
sudo $(which kubectl) delete pod mgmtcompanion-0 -n mgmtcompanion --kubeconfig /etc/rancher/k3s/k3s.yamlRestart TimescaleDB: Should TimescaleDB exhibit unexpected behavior, use the following command to restart it:
sudo $(which kubectl) delete pod united-manufacturing-hub-timescaledb-0 -n united-manufacturing-hub --kubeconfig /etc/rancher/k3s/k3s.yaml
Troubleshooting Redpanda / Kafka
For insights into your Kafka streams managed by Redpanda, these commands are invaluable:
List All Topics: To get an overview of all topics in your Redpanda cluster:
sudo $(which kubectl) exec -it --kubeconfig /etc/rancher/k3s/k3s.yaml -n united-manufacturing-hub united-manufacturing-hub-kafka-0 -- rpk topic listDescribe a Specific Topic: For detailed information about a specific topic, such as
umh.v1.e2e-enterprise.aachen.packaging, use:sudo $(which kubectl) exec -it --kubeconfig /etc/rancher/k3s/k3s.yaml -n united-manufacturing-hub united-manufacturing-hub-kafka-0 -- rpk topic describe umh.v1.e2e-enterprise.aachen.packagingConsume Messages from a Topic: To view messages from a topic like
umh.v1.e2e-enterprise.aachen.packaging, this command is useful for real-time data observation:sudo $(which kubectl) exec -it --kubeconfig /etc/rancher/k3s/k3s.yaml -n united-manufacturing-hub united-manufacturing-hub-kafka-0 -- rpk topic consume umh.v1.e2e-enterprise.aachen.packaging
What’s next?
Now that you have learned how to monitor, manage and configure your UMH instance with the Management Console, you can start creating your first data flow. To learn how to do this, proceed to the Data Acquisition and Manipulation chapter.

