4. Data Visualization
3 minute read
In the following step, we will delve into the process of visualizing the data. This chapter focuses on the construction of dashboards using Grafana. The dashboard will be crafted around the OPC-UA data source and the Node-RED flow, both of which were established in the previous chapter.
Creating a Grafana dashboard
If you haven’t done so already, open and log in to Grafana by following the instructions given in the Acess Grafana section of chapter 2.
Once logged in, hover over the fourth icon in the left menu, dashboards, and click on + New dashboard.
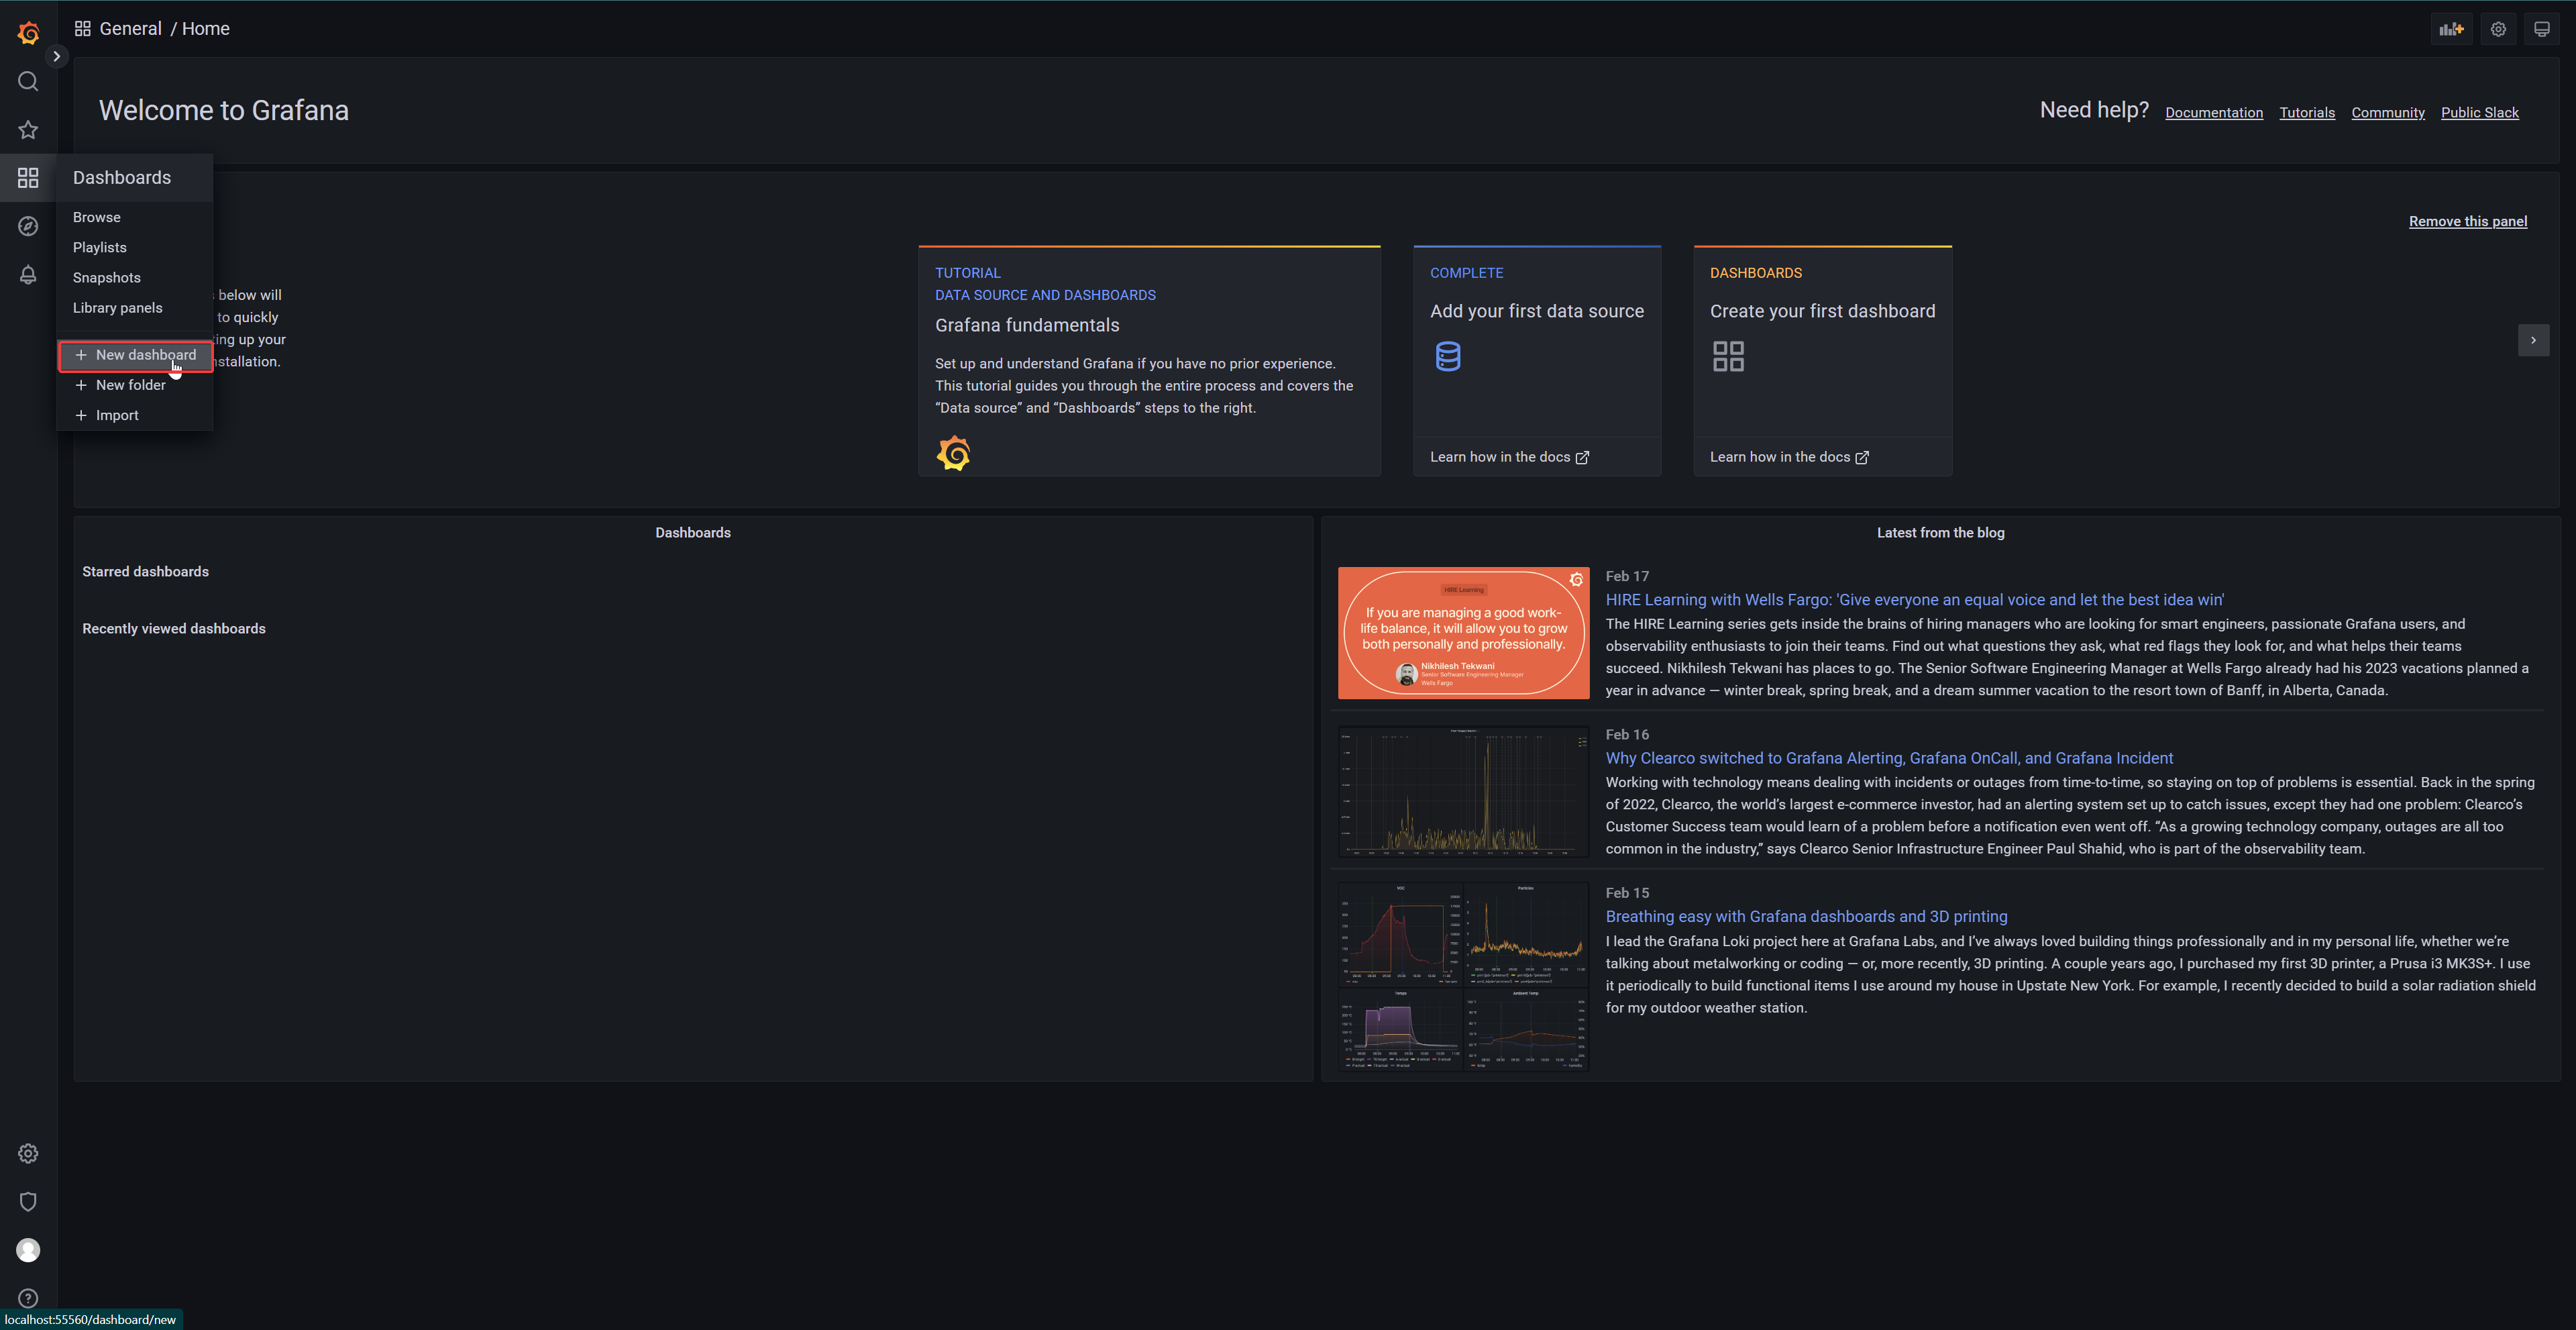
Click on Add a new panel, which will redirect you to the edit panel view.
Next, we’ll retrieve OPC-UA data from TimescaleDB. Before moving forward, ensure that the UMH TimescaleDB data source is selected; it should be the default choice.
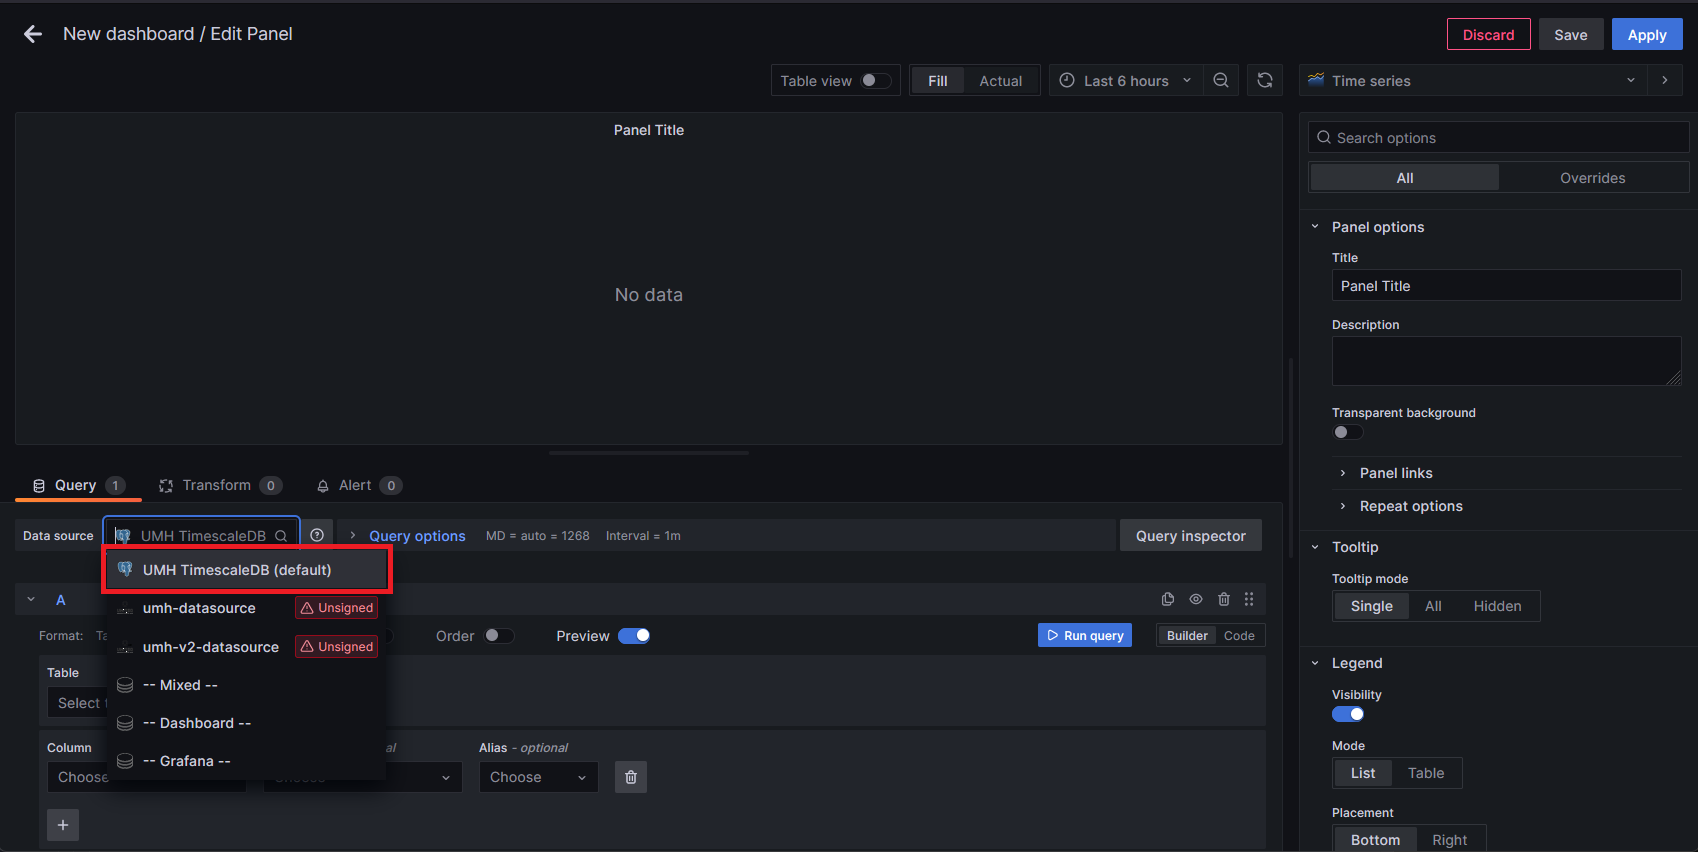
We’ll show you how to run queries with both the Builder mode (a graphical query builder) and the Code mode (a code editor to write RAW SQL). Let’s begin with the graphical approach.
Let’s query all
value,timestampandnamecolumns from thetagtable. For some guidance, refer to the image below.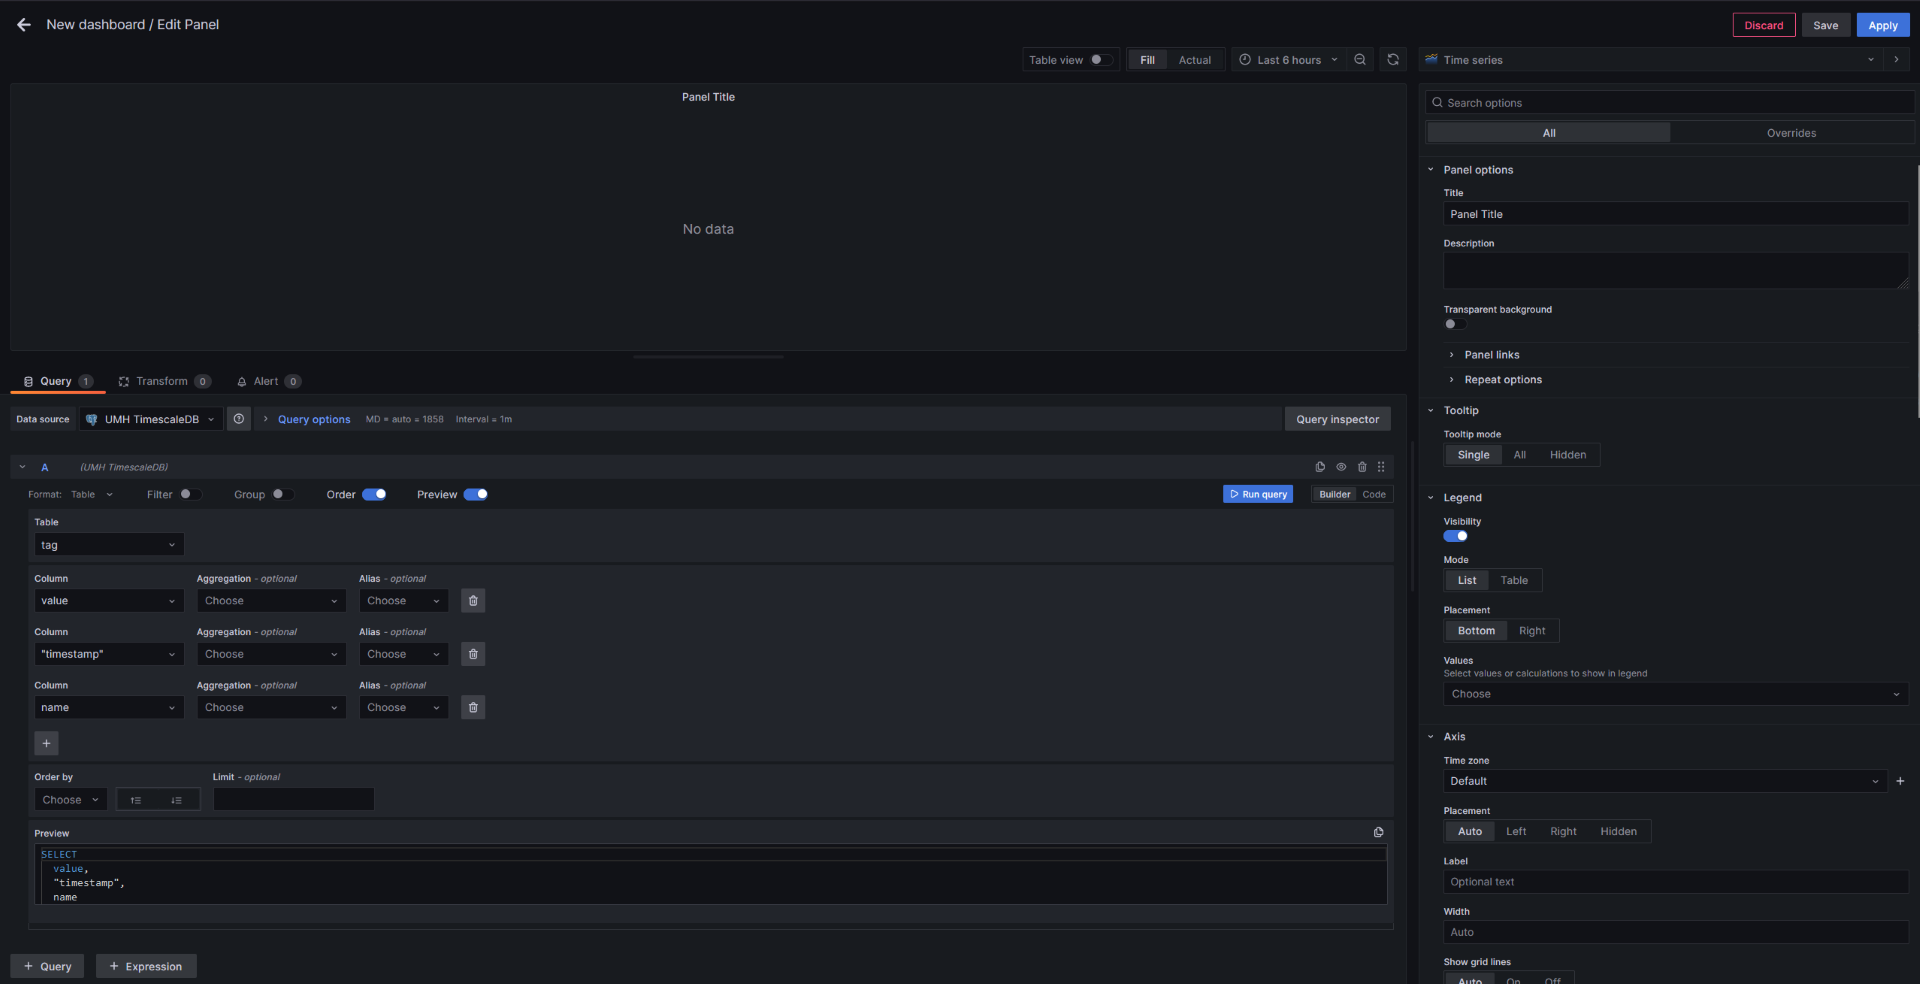
Click on the Run Query button located next to the Builder/Code modes switcher.
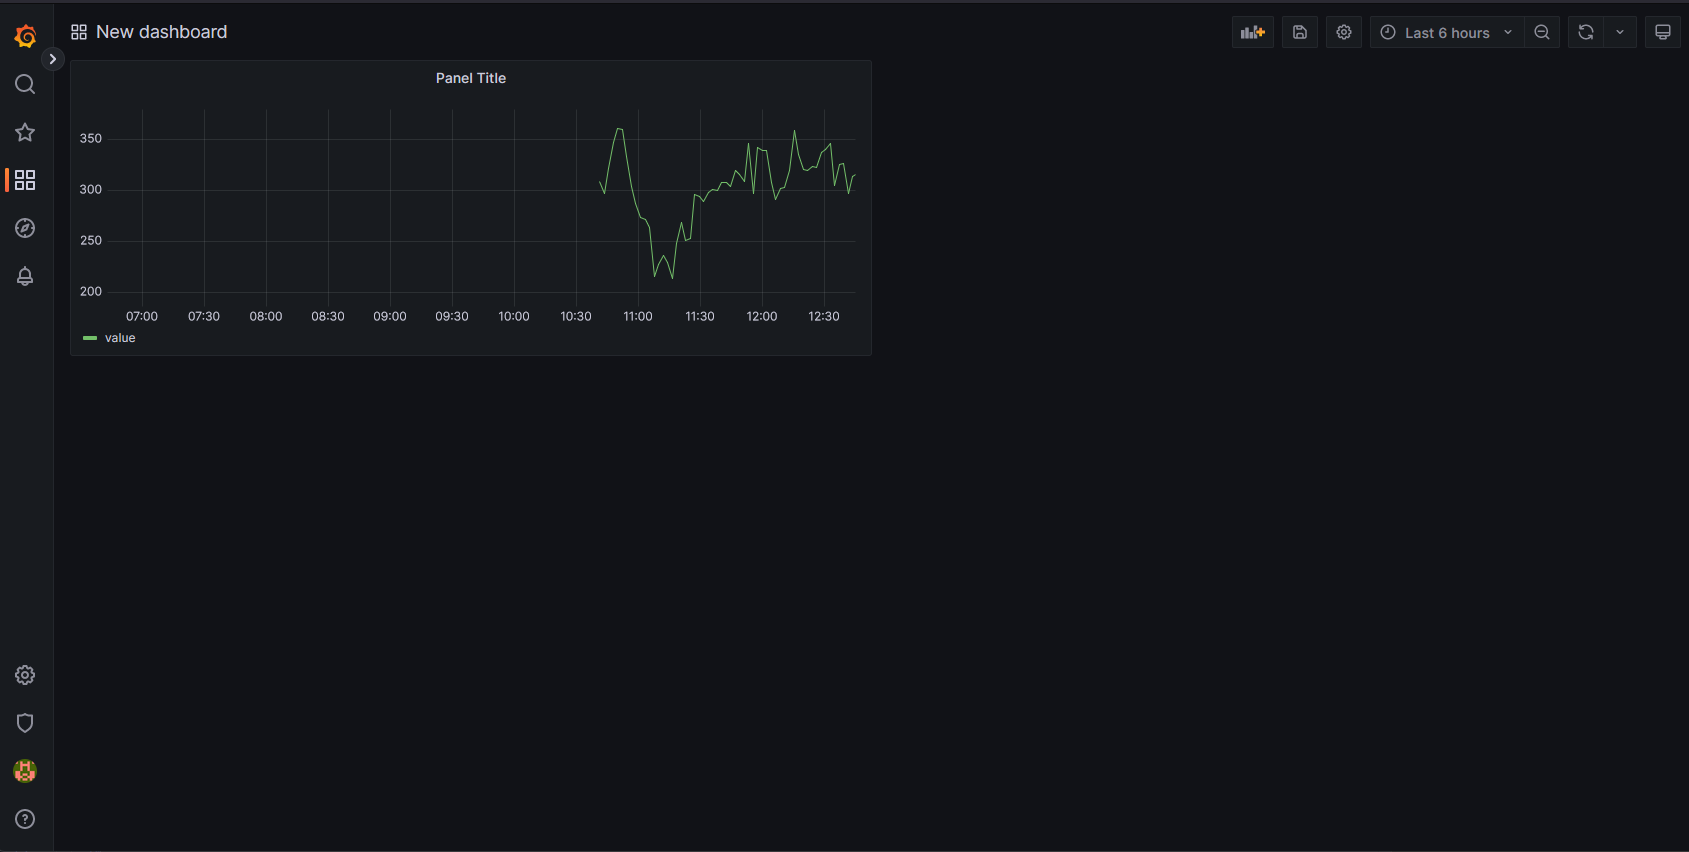
You should now see a time series graph based on the query you just ran. The Builder mode is a great way to get started, but it has its limitations. For more complex use cases, we recommend using the Code mode, which we’ll cover in the next steps.
Open the code editor by switching from Builder to Code.
Now we’ll run a slightly more complex query. We’ll retrieve the same columns as before, but this time only for a specific
asset.SELECT name, value, timestamp FROM tag WHERE asset_id = get_asset_id( 'pharma-genix', 'aachen', 'packaging', 'packaging_1', 'blister', 'PLC13' );
get_asset_id is a custom plpgsql function that we provide to simplify the process of querying
tag data from a specific asset.
In the code snippet above, the arguments provided to the function are based on the OPC-UA node we defined in the
Initialize the Connection
section of the previous chapter, so adjust them accordingly if you used different values, these values can also be
found at the data dashboard of the Management Console, which displays all OPC-UA nodes in a tree structure.
Same as before, click on the Run Query button to execute the query. If you’ve been following along, you won’t see any noticeable changes, since we only have one
assetin our database.Feel free to experiment with different queries to get a better feel for the data model.
Next, you can customize your dashboard. On the right side, you’ll find various options, such as specifying units or setting thresholds. Playaround until it suits your needs.
Once you’re done making adjustments, click on the blue Apply button in the top right-hand corner to save the panel and return to the overview.
Congratulations, you have created your first Grafana dashboard, and for now it should look similar to the one below.
What’s next?
The next topic is Moving to Production where we will explain what it means to move the umh to a manufacturing environment. Click here to proceed.